Тема: IBM Watson Analytics vs. Conventional Econometrical Software: A Comparative Analysis of Suitability for Financial Sector
Закажите новую по вашим требованиям
Представленный материал является образцом учебного исследования, примером структуры и содержания учебного исследования по заявленной теме. Размещён исключительно в информационных и ознакомительных целях.
Workspay.ru оказывает информационные услуги по сбору, обработке и структурированию материалов в соответствии с требованиями заказчика.
Размещение материала не означает публикацию произведения впервые и не предполагает передачу исключительных авторских прав третьим лицам.
Материал не предназначен для дословной сдачи в образовательные организации и требует самостоятельной переработки с соблюдением законодательства Российской Федерации об авторском праве и принципов академической добросовестности.
Авторские права на исходные материалы принадлежат их законным правообладателям. В случае возникновения вопросов, связанных с размещённым материалом, просим направить обращение через форму обратной связи.
📋 Содержание
Chapter I. The state of art predictive analytics 6
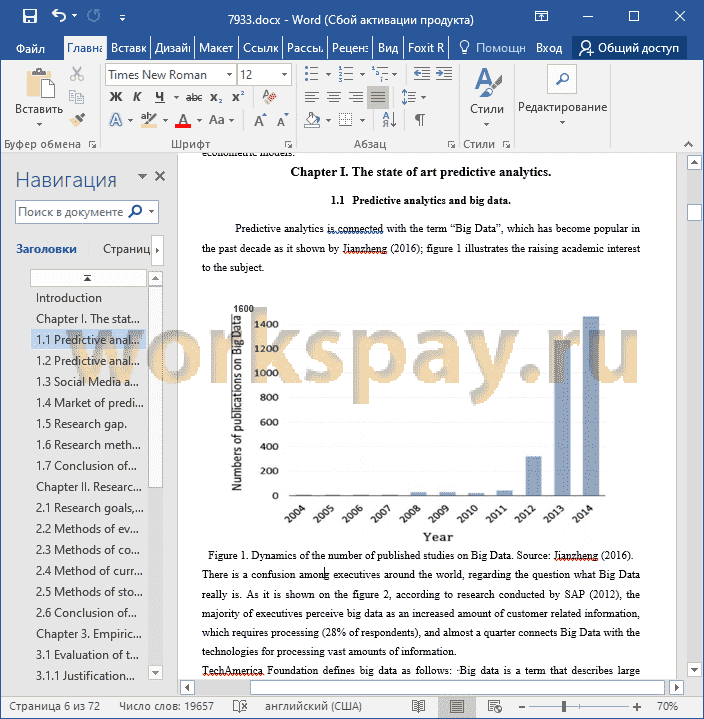
1.1 Predictive analytics and big data 6
1.2 Predictive analytics 10
1.3 Social Media and Business news Analytics 12
1.4 Market of predictive analytics tools in financial sphere 13
1.5 Research gap 14
1.6 Research methodology and organization of the study 15
1.7 Conclusion of Chapter 1 16
Chapter II. Research framework 18
2.1 Research goals, KPIs, objectives, questions, and limitations 18
2.2 Methods of evaluation of advanced analytical platforms 20
2.3 Methods of comparing the forecasting accuracy of IBM Watson and statistical packages 21
2.4 Method of currency exchange rate forecasting using Statistical Packages 22
2.5 Methods of stock forecasting using Statistical packages 23
2.6 Conclusion of Chapter 2 25
Chapter 3. Empirical estimation of analytical platforms 26
3.1 Evaluation of the Analytical Platforms 26
3.1.1 Justification of the choice of analytical platforms taken for consideration 26
3.1.2 Results of Evaluation of Analytical Platforms 28
3.2 Evaluation of the forecasting accuracy of IBM Watson Analytics 30
3.2.1 Data description 30
3.2.2 Forecasting stock prices with theoretically based models 32
3.2.2.1Results of the Random walk models for currencies 32
3.2.2.2 Currency’s exchange rates forecasting using factor models 33
3.2.2.3 Stock forecasting using CAPM model 34
3.2.3 Forecasting stock market using IBM Watson analytics 35
3.2.3.1 Models for stock forecasting 35
3.2.3.2 Models for currency’s exchange rate forecasting 39
3.2.3.3 Analysis of the results of stock price forecasting 42
3.3 Conclusion of the Chapter 3 43
Final Conclusions 44
Discussion of the findings 44
Theoretical implications 45
Managerial implications 46
Limitations 46
List of references 47
Appendix 1. Specifications of Models 50
Appendix 2. Specification of models, suggested by Watson Analytics 53
Appendix 3. Results of the IBM Watson Analytics Predict function for currencies 65
Appendix 4. Results of the IBM Watson Analytics Predict function for stocks 68
📖 Введение
Such a rapid growth of the financial analytics market is driven by the need of financial organizations to manage increasing amounts of structured and unstructured information coming from different sources, as it states Srivastava (2015). In other words, emergence of big data creates a market for advanced analytics.
One of the spheres of financial analysis, which attracts attention of both financial organizations and individual traders, is stock price forecasting. Main characteristic of any financial assets, which is available for all participants of the market, is its price. These prices can be represented as prices of purchase of bonds and stocks, as currency exchange rates, or as interest rates of a bank deposit. The whole assembly of all these values at any given moment in time comprises the conjuncture of the market. There are three main classic methods of the stock price’s dynamic prediction: Technical Analysis, Fundamental Analysis, and Quantitative Analysis.
According to Schwager (1996), Technical analysis is based on the examination of historical trends on the market, which are represented by the market statistic of stock prices and volumes. Technical analysis operates under the assumption that all available and relevant information, including so-called fundamental factors is reflected in the asset’s prices. In addition, technical analyst assumes that some patterns of the stock market are repetitive and can be revealed using indicators, oscillators, and other “technical” methods. The shortcoming of such a methods is an absence of a systematic and scientific basing of the majority of its empirical methods.
Another approach is the Fundamental Analysis. It is based on the evaluation of the fundamental macroeconomic and microeconomic factors. Niemira (1998) claims that, fundamental analysis focuses on the condition of the issuer, on its revenues, market position, etc. Macroeconomic factors, influencing the whole industry and the country (GDP, Unemployment rates, and so on), are also taken into consideration.
The third classic approach to the stock market analysis, as it was described by Curthberston (1996), is Quantitative Analysis, which is based on statistical data, just like technical analysis, but instead of indicators, it uses statistical and mathematical models and tools, which are also referred as econometrical.
A new approach has emerged in the last years - the predictive analytics. It has gained attention due to the increasing amount of the available and relevant to the market information. Mark E. (2006) has estimated, that in 2007-2009 the humanity has generated more information than in the previous 1000 years. This information overload caused the emergence of the term “Big Data”, which refers to the high-volume, high-velocity, and high-variety data. Predictive analytics is a quantitative analysis per se, but with the ability to use it on the “big data”. It uses the same statistical and mathematical tools as quantitative analysis, however, it differs in the research approach: while standard econometric models just test pre-generated, based on theory hypothesis, predictive analytics is capable of finding correlations between variables in huge datasets without preliminary hypothesis i.e. predictive analytics generates its own statistical hypothesis based on the data.
Big Data creates challenges as well as opportunities, financial organization, such as banks have a lot to gain from analyzing Big Data, as Tian (2015, 34) argues: “The large scale of data contain enormously valuable information, and analytics based on big data can provide financial organizations with more business opportunities and the possibility to gain a more holistic view of both market and customers. Big data analytics can benefit banking and financial market firms in many aspects, such as accurate customer analytics, risk analysis and fraud detection. These approaches can lead to smarter and more intelligent trading, which can help organizations to avoid latent risks and provide more personalized services, thus to get a higher degree of competition advantage”. Challenges of analyzing vast amount of high volume, high velocity, and high variety data, which is also presented in both unstructured and structured form, create the need for an advanced analytical tool.
Nowadays, there are multiple analytical platforms available for banking and other financial organizations. Such giants as IBM, Microsoft, Google, and Amazon are offering their analytical products to the market. According to Gartner’s Magic Quadrant of Advance Analytical Platforms (2014), the leading position on the market of analytics platforms belongs to the IBM Corporation, RapidMiner, and SAS. Such a giant as Microsoft is lagging behind, but in a past two years it has showed positive dynamics and now it is catching up with the leaders.
The goal of this research is to determine which of these analytical platforms fits better for fit for the purposes of stock market forecasting. In the theoretical part, we will discuss the influence of the big data and predictive analytics on financial organization’s operations. Then we will define the requirements of these organizations to an analytical platform, and generate the set of KPIs to evaluate the platforms.
Among other KPI’s we will pay attention to the ability of analytical platforms (Using IBM Watson Analytics as an example) to generate predictive models for stock prices forecasting.
We will compare the results with the outcomes of some of the traditional, theoretically based econometric models.
✅ Заключение
First of all, we have evaluated four analytical platforms of interest, based on the Gartner’s Magic Quadrant for Advanced Analytical Platforms 2016 and Forrester Wave 2015: IBM Watson Analytics, SAS analytics, KNIME, and RapidMiner. The main factor, which has determined such choice, is that they were identified as market leaders, strong performers, and visionaries, with the biggest potential for growth.
Our next objectives were the evaluation and comparison of the analytical platforms based on their ability to generate predictive models for stock price forecasting.
For the purposes of the evaluation, we have used a set of six KPI’s: Visualization, Simplicity of Use, Predictive Analytics Capabilities, Econometric Modeling capabilities, Textual analytics capabilities, and Social Media analytics Capabilities. The result of applying Analytical Hierarchy method has demonstrated that IBM Watson and SAS Analytics are the most appropriate tools, when it comes to forecasting stock market. The whole ranking is shown in the Table 18.
Table 18 . Ranking of Analytical platforms.
Analytical platform Priority Ran k
IBM Watson 29.4% 1
SAS 29.0 % 2
KNIME 21.6% 3
RapidMiner 20.0% 4
IBM Watson Analytics has won SAS analytics only by a hair. IBM Watson beats SAS at simplicity of use, but SAS wins when it comes to the range of econometrical and statistical tools, which it offers to users. The ability to suggest predictive factors, without preliminary analysis, is what distinguish IBW Watson and SAS from the others. They are superior in their abilities to conduct Predictive Analytics process, while other platforms require statistical expertise in order to use them to full extend.
Our final objectives were to construct, evaluate and compare the results of theoretically based econometric predictive models, and IBM Watson Analytics suggested models. The results has shown that in terms of deviations of forecasts from the actual values of observed variables (measured in terms of Mean Absolute Percentage Errors), the Random Walk is unbeatable. However, when it comes to the potential profitability of the models (assessed trough trading simulation), theoretically based models has shown worse results, that IBM Watson Analytics suggested models, with the exception of the models, based on the prices of most exported commodities. This result could be explained by the fact, that IBM Watson Analytics didn’t specify the nature of interdependencies between the variables, meaning that further analysis is required in order to determine the exact econometric equation.
Overall, the effectiveness of IBM Watson Analytics as an effective tool for predictive models suggestion was confirmed.
To sum up, we provide direct answers to the Research questions, as it is shown in the Table 20.
Table 20. Research Questions and answers
Research question Answer
Which analytical platforms is a better fit for the purposes of stock market forecasting? IBW Watson Analytics and SAS.
Does IBM Watson Analytics suggest effective predictive models for stock forecasting, in comparison with standard theoretically based econometric models? Yes, IBM Watson Analytics suggest effective predictive models, however, further analysis is required in order to build the most effective predictive model.
Theoretical implications.
1. Using the theoretical part of this work, similar researches of niche analytical platforms (according to Gartner’s Magic quadrant of advanced analytical platforms), such as Prognoz, Accenture, Fico, Megaputer, and Levastorm could be conducted.
2. The research provides a ground for further studies of how different analytical platforms and analytical software tools could be combined in order to construct predictive models.
3. The research can serve as a base for further studies of how big data challenges in financial sector could be tackled using analytical platforms.
4. There are some collateral theoretical results: the theory that currency’s exchange rate could be effectively predicted using the price of the mostly exported commodities was confirmed, however, is models have limited applicability, since they could predict exchange rates only for those currencies which are strongly connected to one particular commodity. In other words, it applies only to resource exporting economies.
5. The inability of CAPM to adequately predict stock prices even on the developed stock market was confirmed, therefore the Effective Market Hypothesis is not met on the US stock market.
6. The research has both confirmed and questioned the unbeatable random walk: in terms of the deviation measures, the random walk remains unbeatable, but from the perspective of forecasting the direction of change, it is outperformed by both theoretically based models, and by those that were suggested by IBM Watson Analytics.
Managerial implications.
1. This research provides interested parties (traders) with the recommendations regarding which analytical platforms to use for the purposes of stock price forecasting.
2. The research provides individual traders with tight budget constraints with the no costs combination of analytical platforms (IBM Watson Analytics as a guide, and Statistical Package (Gretl) for the construction of the final model). This combination could prove to be quite effective, since IBM Watson Analytics is the only tool which is capable of suggesting predictive models without preliminary theoretical work.
3. The study has identified the analytical functions, which analytical platform should be able to perform in order to address the business tasks of the financial organizations.
4. The study provides with the criteria, using which analytical platforms can be chosen.
5. The study has contributed to the analysis of the market of financial analytics.
Limitations.
1. Analytical Hierarchy Process imbeds some level of subjectivity: pairwise comparison of the criteria and alternatives could vary depending on the expert.
2. Only four out of many three analytical platforms were chosen.
3. This study was conducted with the use of open source data gathered from the Finam website. Access to the more possible variables harness the possibility for Watson Analytics to generate better predictive models.
4. All predictive models were estimated under the assumption that investor has real time access to all needed information and can react instantly, in accordance with chosen model.
5. Finally, our simulations were run under the assumption that an investor has instant access to all information, needed for the model building, and that an investor can strike deals instantly, before the market reacts on the changes.
📕 Список литературы
🖼 Скриншоты